Vapor Pressure Deficit (VPD) throughout April '22 - June '22
Our company has three different temperature sensors located in different facilities in New Jersey. These sensors are used to collect data such as daily temperature, humidity and VPD. Our team has converted collected data from sensors into graphs shown below. Based on these graphs, you can visualize decreased levels of VPD in months from April '22 to June '22. During our study of these VPD levels, our team came across an article based on suicide cases of five NCAA athletes in spring 2022.[1] Our team would need further investigation in order to prove a connection between these suicide cases and VPD.
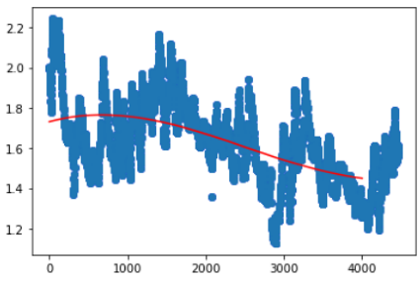
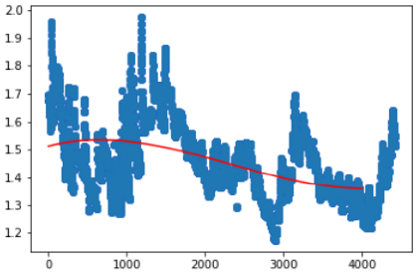
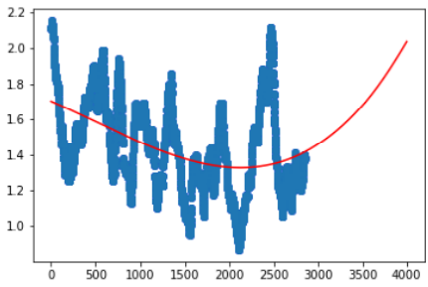
April VPD Levels
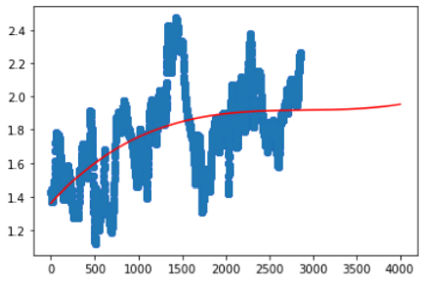
STD2A5WS1
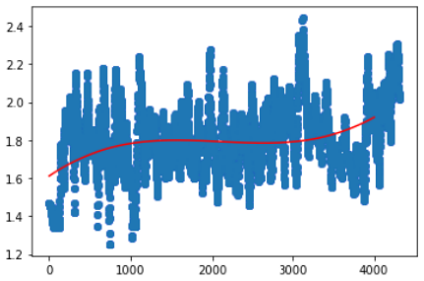
2X5GBGWS1
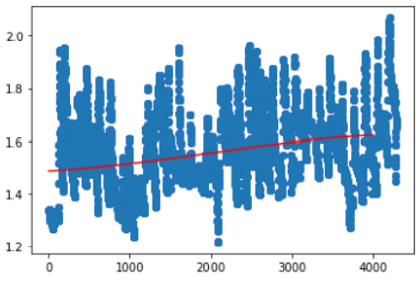
N3RTKFWS1
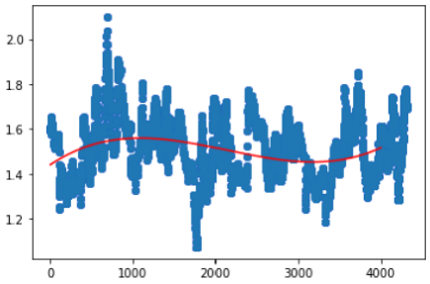
May VPD Levels
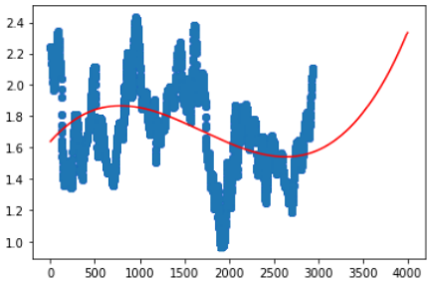
STD2A5WS1
2X5GBGWS1
N3RTKFWS1
June VPD Levels
STD2A5WS1
2X5GBGWS1
N3RTKFWS1